What is happening to Mount Hood's glaciers?
Satellite images from 2013 to 2026, checked against maps made on the ground
On whatcom.land I mapped how Mount Baker’s glaciers have changed since the 1970s. I wondered whether the same approach would work on other mountains, so I tried it on Mount Hood in Oregon.
What do the maps show?
Portland State University mapped Hood’s glaciers twice: from 1956 maps, and from 2015–16 images. Their outlines are in GLIMS, the global glacier inventory. In 2023 a team from the Oregon Glaciers Institute mapped the glaciers again, walking much of the ice edge (Bakken-French et al. 2024).

Figure 1:Mount Hood from the north. Purple: ice on the 1956 map. Pale purple: 2015–16. White, with a teal edge: 2023, mapped in the field. The purple band is ice that is gone.
Open the 3D map to turn the mountain and look at each glacier.
Named glaciers:  1956  15.6 km²
              2015–16   5.8 km²
                 2023   5.9 km²  (field team)
Hood’s named glaciers lost almost two thirds of their area between 1956 and 2015–16. The 2023 total looks about the same as 2015–16, but the two teams drew the edges differently. The field team counted ice buried under rock, which is hard to see on images. Comparing their own outlines over time, they found that Hood’s glaciers lost 17% of their area from 2015–16 to 2023.
What do satellites see each summer?
Landsat satellites photograph Hood every week or two. Clean snow and ice are bright in red light and dark in shortwave infrared, so a simple ratio of the two finds them. For every clear image from late August through September, I measured how much of the 2015–16 glacier area was bright.
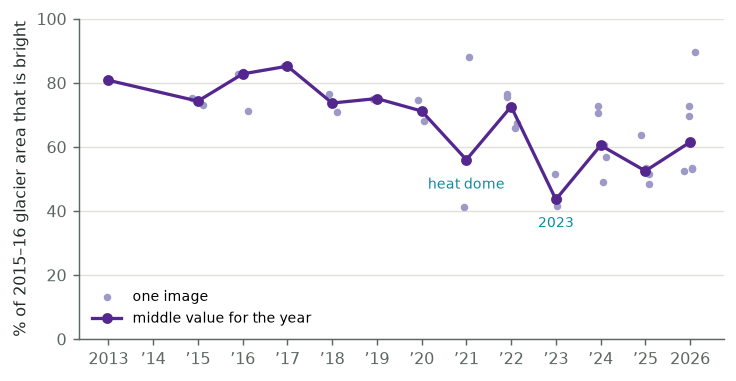
From 2013 to 2020 about three quarters of the glacier area was bright each September. In 2021, the summer of the heat dome, that fell to 56%, then came back the next year. In 2023 it fell to 44%, and it has not come back: it has been between 50% and 62% since. (2014 is missing because clouds covered the mountain in every September image.)
Is the ice gone, or just hidden?
The satellites say Hood lost about a third of its bright surface. The field team says Hood lost 17% of its area. Why the difference?
I checked the satellite images against the field team’s 2023 outlines. This is the share of their 2023 ice that looks bright from space:
The outline is the same in every column; only the year of the image changes. In 2016 about 80% of the ice was bright. Since 2023 it has been about half. On the west side it is much less: Sandy and Ladd glaciers have been mostly dark since 2023.
So much of the change since 2023 is ice going dark, not ice going away. My best guess is that the snow and old firn that used to cover the lower glaciers melted off in 2023, uncovering ice mixed with rock and dirt. From space that looks like bare ground. A survey using only bright ice would overstate Hood’s glacier loss about twofold.
What don’t I understand?
How much of the dark ice is under a thin layer of dirt, and how much under thick rock? A thin layer makes ice melt faster; thick rock slows it down.
Will the dark lower glaciers keep their area while they thin? Repeat lidar would show thinning, even under rock. I have not yet looked for repeat lidar of Hood.
The same method gave a much better match on Mount Baker, where the glaciers carry less rock. How many Cascade glaciers look more like Hood than Baker?
What did I get wrong?
If you know Hood’s glaciers, or this kind of data, better than I do, I would like to hear from you. The code, data and a longer methods note are on GitHub, and issues are open.
Sources
Glacier outlines for 1956 and 2015–16: Portland State University, via GLIMS (NSIDC).
Glacier outlines for 2023: Oregon Glaciers Institute, Oregon Glaciers Institute (2024), CC BY 4.0. The study: Bakken-French et al. (2024), Unprecedented 21st century glacier loss on Mt. Hood, Oregon, USA, The Cryosphere 18, 4517–4530.
Images: Landsat 8 and 9 (USGS) and Sentinel-2 (ESA Copernicus), via Microsoft Planetary Computer.
3D terrain: AWS Terrain Tiles (Mapzen), from USGS 3DEP. Map colours and 3D view: the same as whatcom.land.
- Bakken-French, N., Boyer, S. J., Southworth, B. C., Thayne, M., Rood, D. H., & Carlson, A. E. (2024). Unprecedented 21st century glacier loss on Mt. Hood, Oregon, USA. The Cryosphere, 18(9), 4517–4530. 10.5194/tc-18-4517-2024
- Oregon Glaciers Institute. (2024). 2023 Mt. Hood Glacier Margins for “Unprecedented Twenty-First Century Glacier Loss on Mt. Hood, Oregon, U.S.A.” Zenodo. 10.5281/ZENODO.13356244